
News
Why the USGA, R&A 2015 Distance Report is a Joke
Earlier this morning the USGA and R&A released a Joint Distance Study examining driving distance data across the multiple professional golf tours.
In summary, the report states that the increase in driver distance has been more of a crawl over the past two decades with the advances in club and ball technology having little impact to the game.
Now that we’re all done with our collective eye-roll, I’ll continue.
We roll our eyes at this conclusion because, well, because of our eyes. Anyone who has been watching the game of golf over the past ten to twenty years simply knows better. And those of us who have been playing the game for even less time also know better.
But in the spirit of the scientific method and using data as evidence rather than our own “we know what we see” intuition, let’s explore the data.
In the report, the USGA and R&G claim between 2003 and the end of the 2015 season, average driving distance on four of the seven tours increased about 1%, or 0.2 yards per year. Here is the first, fundamental flaw of the report: looking at year on year change.
While this statement is technically true, this is essentially the equivalent of measuring the growth of a child and only reporting the year to year change. In turn, you are ignoring how much taller the child is actually getting across the overall span of time. Suddenly, you look at your kid twenty years later and he’s six feet tall and you’re asking yourself, “when did that happen?!”
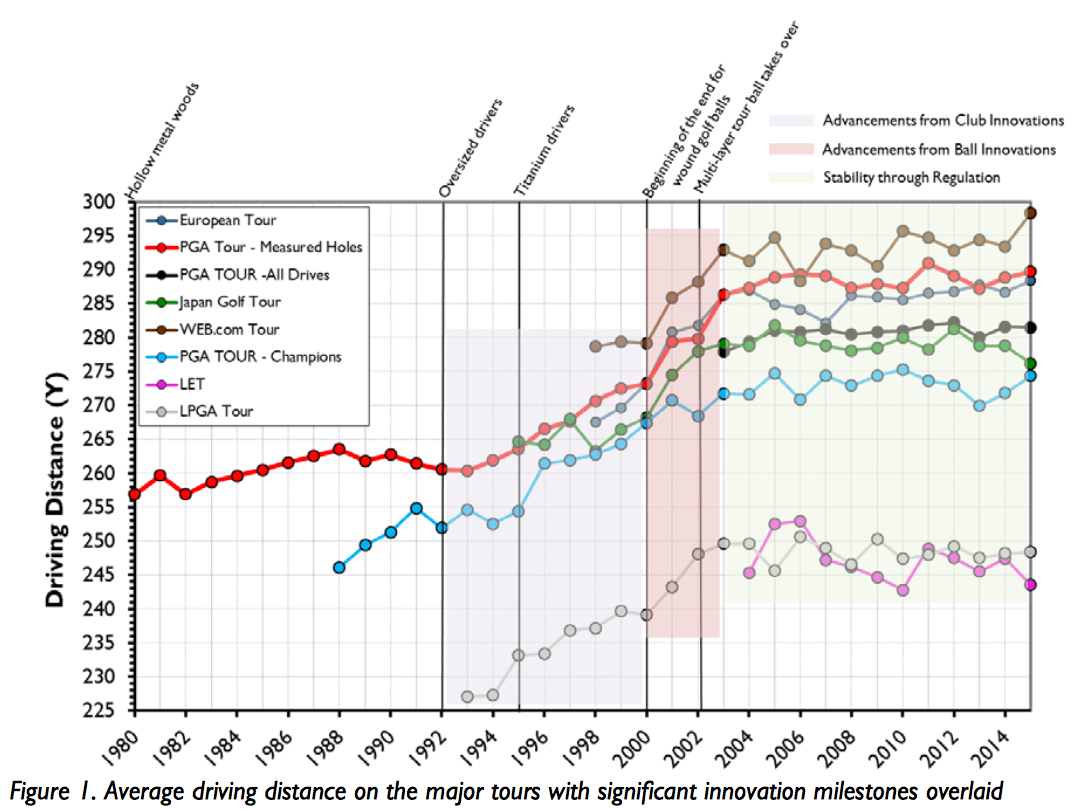
Take a look again at the red line representing the “measured holes” of the PGA TOUR. In 1992, with the advent of the over-sized driver, average driving distance is about 260 yards. Ten years later, players are hitting the ball an average of 20 yards farther with the driver.
Now let’s put that twenty additional yards to work in an actual scenario. A pro hits driver in 2002 on a par-4, 400 yard hole, that means his second shot is going to be 140 yards. In 2012, the same drive leaves him with 120 yards to the hole. A ny hack on a municipal course on a Sunday morning will tell you how significant those twenty yards are.
Fast forward from 2002 to 2012 and pros are now hitting driver another ten yards farther. Meaning over a twenty year span, golfers on the PGA TOUR gained an extra 30 yards off the tee.
Oh, and before you tell me, “players today are in better shape and more athletic,” allow me to point out that the Champions Tour guys—you know, the old dudes—are hitting the ball 275 yards today versus 250 yards twenty years ago.
Moving through the report a bit more, they present a table showing year on year yardage gain since 2003.
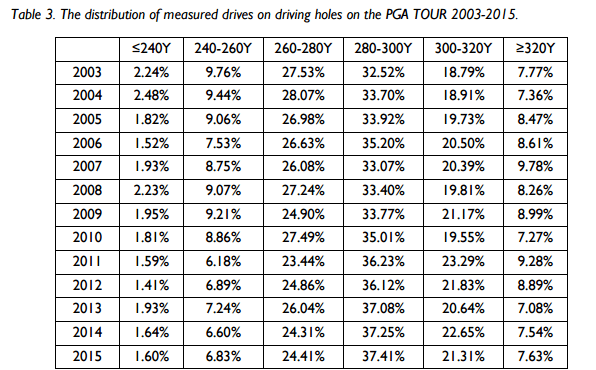
Again, looking at this data vertically doesn’t set off many alarms. In general, the percentages of length of drives vary about 1%. But look at the data horizontally from year to year. In other words, look at the distribution of percent of players hitting it the different lengths.
In 2003, only 5% of players hit the ball between 280 – 300 yards then those that hit the ball between 260 to 280. Compare that to 2015, in which that gap has almost tripled and sits at 13%. Also, look at the combined percentages of players that hit the ball 280 yards or farther in 2003, 59%, against today, which is 66%.
So while distance off the tee has increased thirty yards over the past twenty years, the number of golfers hitting it that distance has simultaneously increased over the past two decades.
Finally, this report, in its effort to show “skill, not technology” is the determining factor of who is most skillful at the game of golf, it leaves out two major pieces of technology. Irons and golf balls.
In fact, you could make the case that in today’s game, those two pieces of technology have a much larger effect on the game than does the driver. Many players today don’t even pull driver on par-5s anymore. They simply don’t need to.
Why the USGA and R&A put this report out in the first place is beyond me. It certainly won’t quiet the critics. Why not embrace the length these guys are hitting the ball if you don’t have an issue with it? At least then you’re being honest and up-front with everyone, rather than putting out a bunch of charts and graphs with twisted logic.

Is LIV Set to Make More Big Changes to Survive?

Best Golf Gifts for Dad: Father’s Day Gift Guide 2026
Another Major PGA TOUR Schedule Shakeup
 | Save with the GOLFICITY Discount")
Lagoon Sleep Coupon Code (2026) | Save with the GOLFICITY Discount

7 Underrated Tips to Get the Most Out of Your Next Golf Trip
Another Major PGA TOUR Schedule Shakeup
7 Underrated Tips to Get the Most Out of Your Next Golf Trip
Is LIV Set to Make More Big Changes to Survive?
Best Golf Gifts for Dad: Father’s Day Gift Guide 2026
Lagoon Sleep Coupon Code (2026) | Save with the GOLFICITY Discount

We Played This Old Golf Course Where Thomas Edison Was A Member

Are You MEASURING Your Golf Swing Correctly? (This Can Help)

Zach Johnson Explains Why He Didn’t Pick Bryson DeChambeau for the Ryder Cup

Justin Thomas FIRES Coach before Ryder Cup…Who’s Next?
